Here, I briefly summarize the process of solving questions or problems I encountered while using Wordpress Table Manager, a wordpress table plug-in.
Chart improvements(9/21)
I made a us employment indicator data table. And it’s OK
Here, I put the most recent data at the front. This is because the data that visitors are most interested in is recent data.
| Month | Nonfarm Payrolls (K) | Nonfarm Payrolls Forecast (K) | Total Nonfarm (M) | Unemployment(%) |
|---|
However, generating a graph causes some problems.
If I generate a graph based on the data from the table I made above, here the latest data appears on the far left side of the graph. And the most past data appears on the far right.
I want to make it possible for recent data to come out to the far right, like a regular graph.
Is there any way?
Table problem(6/17)
Some table can not show table styles & table setting
The tables below nomally reflects the table style and setting. There is no problems.
| Year | 10y | 11y | 12y | 13y | 14y | 15y | 16y | 17y | 18y | 19y | 20y |
|---|---|---|---|---|---|---|---|---|---|---|---|
| World EV sales(K) | 16 | 55 | 126 | 207 | 321 | 540 | 783 | 1,254 | 2,076 | 2,260 | 3,238 |
| YoY(%) | 67 | 55 | 69 | 46 | 59 | 65 | 9 | 43 | |||
| % of EV | 0.01 | 0.1 | 0.2 | 0.2 | 0.4 | 0.6 | 0.9 | 1.3 | 2.2 | 2.5 | 4.2 |
| Rank | Code | Name | Market Cap | Stock Price($) | Country |
|---|
But the table below does not reflect table style and setting at all. There are so many problems.
| CategoryYear | 01 | 02 | 03 | 04 | 05 | 06 | 07 | 08 | 09 | 10 | 11 | 12 | 13 | 14 | 15 | 16 | 17 | 18 | 19 | 20 |
|---|---|---|---|---|---|---|---|---|---|---|---|---|---|---|---|---|---|---|---|---|
| Global Total($B) | 23.6 | 22.1 | 20.5 | 20.4 | 19.9 | 19.3 | 18.1 | 16.8 | 15.7 | 14.9 | 14.7 | 14.8 | 14.5 | 14.0 | 14.5 | 15.8 | 17.0 | 18.7 | 20.2 | 21.6 |
| YoY(%) | - 6.4 | - 7.2 | - 0.5 | - 2.5 | - 3.0 | - 6.2 | - 7.2 | - 6.5 | - 5.1 | - 1.3 | 0.7 | - 2.0 | - 3.4 | 3.6 | 9.0 | 7.6 | 10.0 | 8.0 | 6.9 | |
| Physical(B$) | 23.0 | 21.3 | 19.7 | 19.1 | 17.9 | 16.2 | 14.0 | 11.9 | 10.3 | 8.9 | 8.2 | 7.6 | 6.7 | 6.0 | 5.7 | 5.5 | 5.2 | 4.7 | 4.4 | 4.2 |
| YoY(%) | - 7.4 | - 7.5 | - 3.0 | - 6.3 | - 9.5 | - 13.6 | - 15.0 | - 13.4 | - 13.6 | - 7.9 | - 7.3 | - 11.8 | - 10.4 | - 5.0 | - 3.5 | - 5.5 | - 9.6 | - 6.4 | - 4.5 | |
| Streaming(B$) | 0.1 | 0.1 | 0.2 | 0.3 | 0.4 | 0.4 | 0.6 | 1.0 | 1.4 | 1.9 | 2.8 | 4.6 | 6.5 | 9.2 | 11.2 | 13.4 | ||||
| YoY(%) | - | 100.0 | 50.0 | 33.3 | - | 50.0 | 66.7 | 40.0 | 35.7 | 47.4 | 64.3 | 41.3 | 41.5 | 21.7 | 19.6 | |||||
| Downloads(B$) | 0.4 | 1.0 | 2.0 | 2.7 | 3.4 | 3.7 | 3.9 | 4.2 | 4.4 | 4.3 | 4.0 | 3.7 | 3.2 | 2.6 | 1.7 | 1.5 | 1.2 | |||
| YoY(%) | 150.0 | 100.0 | 35.0 | 25.9 | 8.8 | 5.4 | 7.7 | 4.8 | - 2.3 | - 7.0 | - 7.5 | - 13.5 | - 18.8 | - 34.6 | - 11.8 | - 20.0 | ||||
| Performance($B) | 0.6 | 0.7 | 0.8 | 0.9 | 0.9 | 1.0 | 1.2 | 1.2 | 1.3 | 1.4 | 1.4 | 1.5 | 1.7 | 1.8 | 1.9 | 2.2 | 2.3 | 2.6 | 2.5 | 2.3 |
| YoY(%) | 16.7 | 14.3 | 12.5 | - | 11.1 | 20.0 | - | 8.3 | 7.7 | - | 7.1 | 13.3 | 5.9 | 5.6 | 15.8 | 4.5 | 13.0 | - 3.8 | - 8.0 | |
| Synchronisation($B) | 0.3 | 0.3 | 0.3 | 0.3 | 0.3 | 0.4 | 0.4 | 0.4 | 0.5 | 0.5 | 0.4 | |||||||||
| YoY(%) | - | - | - | - | 33.3 | - | - | 25.0 | - | - 20.0 | ||||||||||
| 05 | 06 | 07 | 08 | 90 | 10 | 11 | 12 | 13 | 14 | 15 | 16 | 17 | 18 | 19 | 20 | |||||||||||||||||||||||||||||||||||||||
|---|---|---|---|---|---|---|---|---|---|---|---|---|---|---|---|---|---|---|---|---|---|---|---|---|---|---|---|---|---|---|---|---|---|---|---|---|---|---|---|---|---|---|---|---|---|---|---|---|---|---|---|---|---|---|
| 매출(억원) | 103 | 125 | 125 | 153 | 192 | 184 | 208 | 264 | 265 | 265 | 303 | 373 | 484 | 635 | 828 | 847 | ||||||||||||||||||||||||||||||||||||||
| YoY(%) | 21 | 0 | 22 | 25 | - 4 | 13 | 27 | 0 | 0 | 14 | 23 | 30 | 31 | 30 | 2 | |||||||||||||||||||||||||||||||||||||||
| 매출총이익 | 38 | 39 | 52 | 71 | 91 | 92 | 108 | 122 | 158 | 173 | 183 | 208 | 231 | 300 | 348 | 352 | ||||||||||||||||||||||||||||||||||||||
| YoY(%) | 3 | 34 | 35 | 28 | 1 | 17 | 12 | 30 | 9 | 6 | 13 | 11 | 30 | 16 | 1 | |||||||||||||||||||||||||||||||||||||||
| 매출총이익률(%) | 37 | 31 | 42 | 46 | 47 | 50 | 52 | 46 | 60 | 65 | 60 | 56 | 48 | 47 | 42 | 42 | ||||||||||||||||||||||||||||||||||||||
| 영업이익(억원) | 5 | 8 | 5 | 2 | 14 | 13 | 1 | 9 | 40 | 29 | 26 | 45 | 37 | 88 | 78 | 92 | ||||||||||||||||||||||||||||||||||||||
| YoY(%) | 64 | - 36 | - 59 | 557 | - 5 | - 93 | 881 | 329 | - 26 | - 10 | 72 | - 19 | 140 | - 11 | 17 | |||||||||||||||||||||||||||||||||||||||
| 영업이익률(%) | 5 | 6 | 4 | 1 | 7 | 7 | 0 | 3 | 15 | 11 | 9 | 12 | 8 | 14 | 9 | 11 | ||||||||||||||||||||||||||||||||||||||
| 순이익(억원) | 6 | 3 | 4 | 4 | 11 | 14 | 2 | 12 | 33 | 27 | 38 | 41 | 30 | 78 | 61 | 70 | ||||||||||||||||||||||||||||||||||||||
| YoY(%) | - 44 | 25 | - 7 | 212 | 29 | - 89 | 678 | 176 | - 19 | 43 | 7 | - 26 | 156 | - 22 | 15 | |||||||||||||||||||||||||||||||||||||||
| 순이익률(%) | 5 | 2 | 3 | 2 | 6 | 8 | 1 | 5 | 13 | 10 | 13 | 11 | 6 | 12 | 7 | 8 | ||||||||||||||||||||||||||||||||||||||
| 70 | 71 | 72 | 73 | 74 | 75 | 76 | 77 | 78 | 79 | 80 | 81 | 82 | 83 | 84 | 85 | 86 | 87 | 88 | 89 | 90 | 91 | 92 | 93 | 94 | 95 | 96 | 97 | 98 | 99 | 00 | 01 | 02 | 03 | 04 | 05 | 06 | 07 | 08 | 09 | 10 | 11 | 12 | 13 | 14 | 15 | 16 | 17 | 18 | 19 | 20 | 21 (F) | 22 (F) | |
|---|---|---|---|---|---|---|---|---|---|---|---|---|---|---|---|---|---|---|---|---|---|---|---|---|---|---|---|---|---|---|---|---|---|---|---|---|---|---|---|---|---|---|---|---|---|---|---|---|---|---|---|---|---|
| Global Game Market Revenue($B) | 1 | 2 | 3 | 6 | 15 | 25 | 22 | 15 | 22 | 35 | 38 | 42 | 37 | 26 | 14 | 15 | 17 | 22 | 27 | 30 | 33 | 37 | 42 | 38 | 34 | 34 | 34 | 36 | 39 | 43 | 43.5 | 48 | 52 | 56.5 | 57 | 62 | 68 | 73.5 | 76.5 | 78 | 78.8 | 82.8 | 85.4 | 91.2 | 97.1 | 107.7 | 122.0 | 138.7 | 152.1 | 164.6 | 178.2 | 196.0 | |
| YoY(%) | 100 | 50 | 100 | 150 | 67 | -"0" | -"0" | 47 | 59 | 9 | 11 | -"0" | -"0" | -"0" | 7 | 13 | 29 | 23 | 11 | 10 | 12 | 14 | -"0" | -"0" | 0 | 0 | 6 | 8 | 10 | 1 | 10 | 8 | 9 | 1 | 9 | 10 | 8 | 4 | 2 | 1 | 5 | 3 | 7 | 6 | 11 | 13 | 14 | 10 | 8 | 8 | 10 |
[Solved] Chart problem – First column data automatically add to chart
I made a table like below

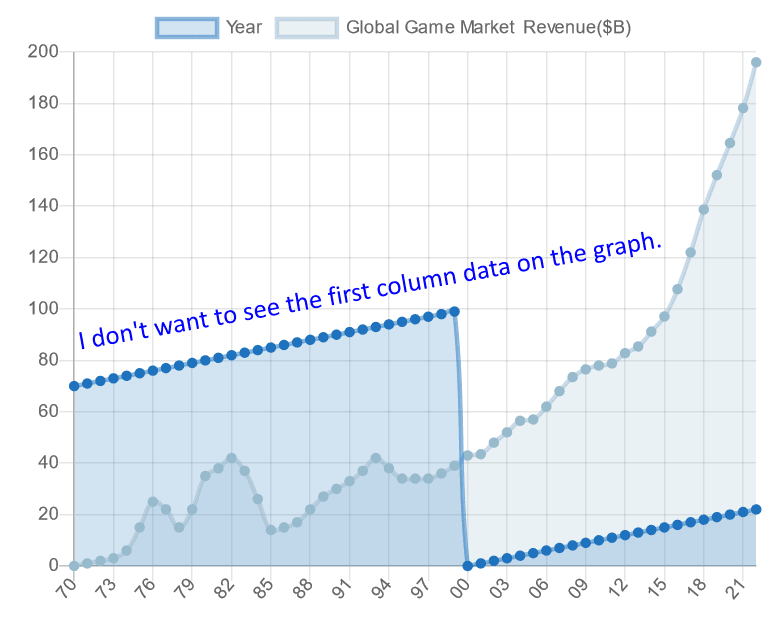
and I made a line chart. But this line chart autumatically add 1st cloumn data ‘year’
I don’t want to see the first column data on the graph.
Look below image

This problem has been solved, but it still remains
Chart problem2 – Legend issue
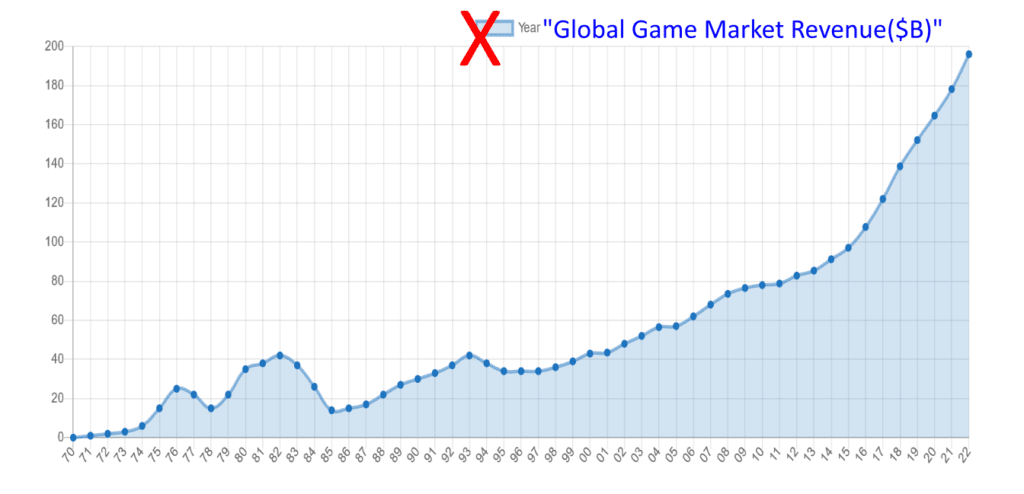
The legend should bring the first data of the second row, not the first row. The graph should show “Global Game Market Revenue ($B). “Year” is a misrepresentation.
Look below image

Don’t work table style – Sloved
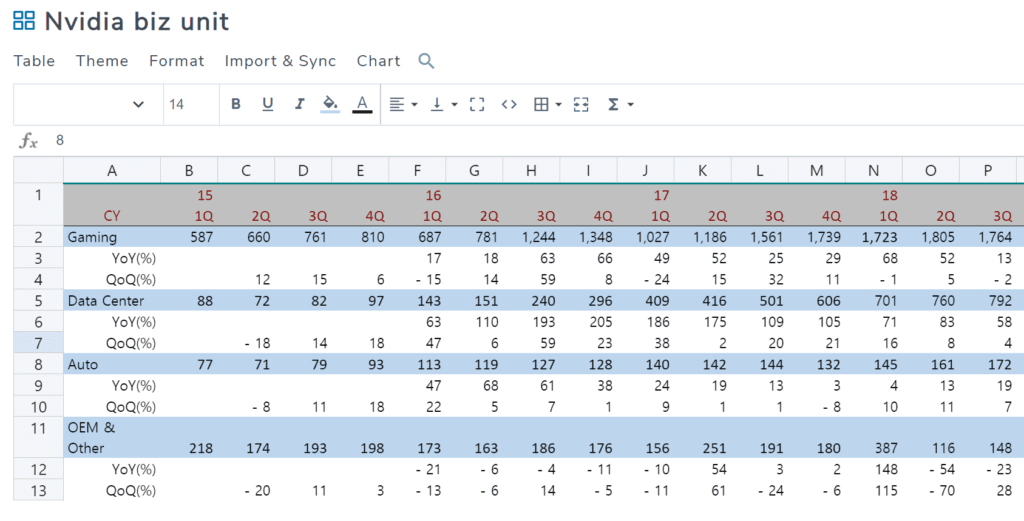
In plugin edit table, I made a table with some style
look below image

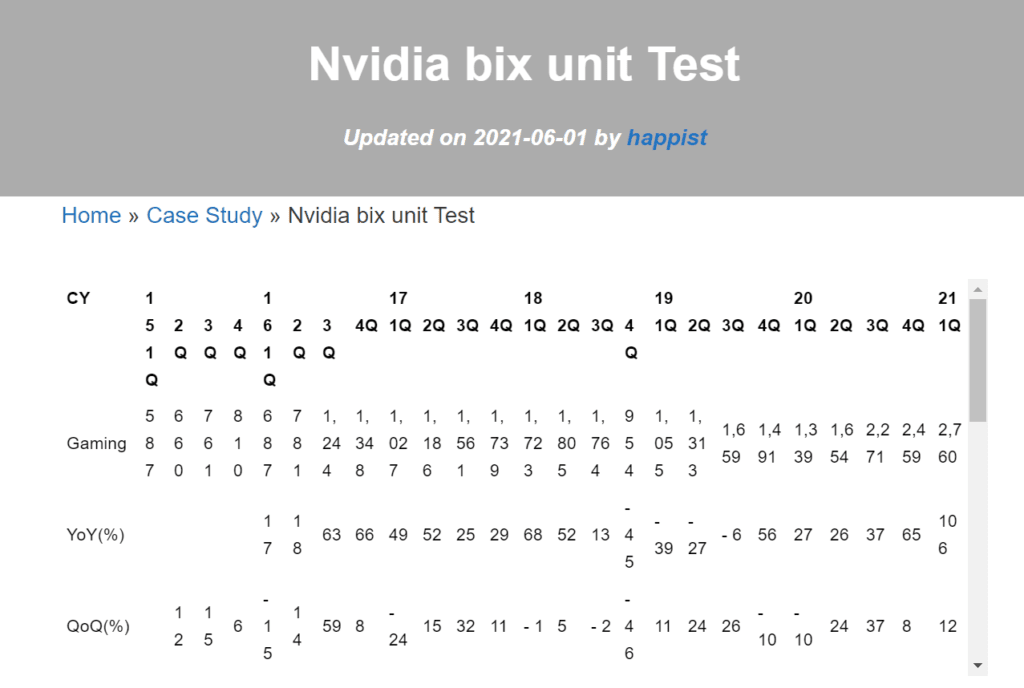
But, in post page, this table look with no table style
Look below post preview image

| CY | 15 1Q | 2Q | 3Q | 4Q | 16 1Q | 2Q | 3Q | 4Q | 17 1Q | 2Q | 3Q | 4Q | 18 1Q | 2Q | 3Q | 4Q | 19 1Q | 2Q | 3Q | 4Q | 20 1Q | 2Q | 3Q | 4Q | 21 1Q | |
|---|---|---|---|---|---|---|---|---|---|---|---|---|---|---|---|---|---|---|---|---|---|---|---|---|---|---|
| Gaming | 587 | 660 | 761 | 810 | 687 | 781 | 1,244 | 1,348 | 1,027 | 1,186 | 1,561 | 1,739 | 1,723 | 1,805 | 1,764 | 954 | 1,055 | 1,313 | 1,659 | 1,491 | 1,339 | 1,654 | 2,271 | 2,459 | 2,760 | |
| YoY(%) | 17 | 18 | 63 | 66 | 49 | 52 | 25 | 29 | 68 | 52 | 13 | - 45 | - 39 | - 27 | - 6 | 56 | 27 | 26 | 37 | 65 | 106 | |||||
| QoQ(%) | 12 | 15 | 6 | - 15 | 14 | 59 | 8 | - 24 | 15 | 32 | 11 | - 1 | 5 | - 2 | - 46 | 11 | 24 | 26 | - 10 | - 10 | 24 | 37 | 8 | 12 | ||
| Data Center | 88 | 72 | 82 | 97 | 143 | 151 | 240 | 296 | 409 | 416 | 501 | 606 | 701 | 760 | 792 | 679 | 634 | 655 | 726 | 968 | 1,141 | 1,752 | 1,900 | 1,903 | 2,048 | |
| YoY(%) | 63 | 110 | 193 | 205 | 186 | 175 | 109 | 105 | 71 | 83 | 58 | 12 | - 10 | - 14 | - 8 | 43 | 80 | 167 | 162 | 97 | 79 | |||||
| QoQ(%) | - 18 | 14 | 18 | 47 | 6 | 59 | 23 | 38 | 2 | 20 | 21 | 16 | 8 | 4 | - 14 | - 7 | 3 | 11 | 33 | 18 | 54 | 8 | 0 | 8 | ||
| Auto | 77 | 71 | 79 | 93 | 113 | 119 | 127 | 128 | 140 | 142 | 144 | 132 | 145 | 161 | 172 | 163 | 166 | 209 | 162 | 163 | 155 | 111 | 125 | 145 | 154 | |
| YoY(%) | 47 | 68 | 61 | 38 | 24 | 19 | 13 | 3 | 4 | 13 | 19 | 23 | 14 | 30 | - 6 | 0 | - 7 | - 47 | - 23 | - 11 | - 1 | |||||
| QoQ(%) | - 8 | 11 | 18 | 22 | 5 | 7 | 1 | 9 | 1 | 1 | - 8 | 10 | 11 | 7 | - 5 | 2 | 26 | - 22 | 1 | - 5 | - 28 | 13 | 16 | 6 | ||
| OEM & Other | 218 | 174 | 193 | 198 | 173 | 163 | 186 | 176 | 156 | 251 | 191 | 180 | 387 | 116 | 148 | 116 | 99 | 111 | 143 | 152 | 138 | 146 | 194 | 153 | 327 | |
| YoY(%) | - 21 | - 6 | - 4 | - 11 | - 10 | 54 | 3 | 2 | 148 | - 54 | - 23 | - 36 | - 74 | - 4 | - 3 | 31 | 39 | 32 | 36 | 1 | 137 | |||||
| QoQ(%) | - 20 | 11 | 3 | - 13 | - 6 | 14 | - 5 | - 11 | 61 | - 24 | - 6 | 115 | - 70 | 28 | - 22 | - 15 | 12 | 29 | 6 | - 9 | 6 | 33 | - 21 | 114 |
plugin don’t show chart it self – Sloved
I insert short code “
but don’t show any chart below
| Browser | 09 | 10 | 11 | 12 | 13 | 14 | 15 | 16 | 17 | 18 | 19 | 20 | 21 |
|---|---|---|---|---|---|---|---|---|---|---|---|---|---|
| IE | 89.3 | 92.6 | 8.5 | 58.3 | 51.8 | 52.6 | 49.5 | 29.1 | 2.8 | 15.2 | 1.3 | 6.9 | 3.8 |
| Chrome | 1.6 | 1.9 | 4.2 | 11.8 | 15.1 | 25.7 | 36.7 | 48.8 | 53.1 | 56.2 | 54.2 | 56.0 | 52.6 |
| Android | 1.3 | 11.0 | 21.5 | 25.9 | 14.8 | 4.3 | 2.3 | 1.3 | 0.5 | 0.2 | 0.1 | 0.1 | |
| Safari | 1.2 | 1.0 | 1.5 | 5.0 | 4.4 | 4.3 | 6.6 | 8.3 | 9.8 | 14.2 | 13.7 | 11.3 | 13.3 |
| Samsung Internet | 6.6 | 1.4 | 9.5 | 12.0 | 11.8 | 13.6 | |||||||
| Firefox | 7.0 | 2.7 | 2.3 | 3.8 | 1.8 | 1.2 | 1.3 | 1.6 | 1.2 | 0.8 | 0.9 | 1.1 | 0.9 |
| Whale Browser | 0.1 | 0.6 | 4.0 | 6.7 | 8.2 | ||||||||
| Puffin | 0.5 | 0.8 | 0.5 | 0.5 | 0.3 | 0.3 | 2.2 | 1.4 | 1.1 | ||||
| Edge Legacy | 0.2 | 1.2 | 1.6 | 1.6 | 2.8 | 1.5 | 0.2 | ||||||
| Opera | 0.3 | 0.2 | 0.1 | 0.2 | 0.2 | 0.2 | 0.3 | 0.5 | 0.5 | 0.4 | 0.5 | 0.4 | 0.4 |
| Edge | 2.5 | 5.5 | |||||||||||
| Swing | 0.1 | 0.3 | 0.4 | 0.4 | 0.2 | 0.1 | 0.4 | 0.2 | |||||
| UC Browser | 0.1 | 0.1 | 0.3 | 0.9 | 0.2 | 0.2 | 0.1 | 0.1 | 0.1 | 0.1 | |||
| Maxthon | 0.2 | 0.9 | 0.1 | 0.2 | 0.8 | 0.3 | 0.3 | 0.4 | 0.2 | 0.1 | 0.1 | 0.1 | 0.1 |
| 360 Safe Browser | 0.4 | 0.3 | 0.4 | 0.7 | 0.8 | 0.4 | 0.2 | 0.1 | 0.8 | 0.9 | |||
| Unknown | 0.5 | 0.1 | 0.6 | 0.3 | 0.1 | 0.1 | 0.2 | 0.1 | |||||
| Sogou Explorer | 0.2 | 0.2 | 0.2 | 0.3 | 0.3 | 0.1 | 0.1 | 0.2 | 0.2 | 0.2 | |||
| QQ Browser | 0.1 | 0.1 | 0.2 | 0.2 | 0.2 | 0.2 | 0.3 | 0.4 | 0.4 | 0.4 | |||
| Windows Media Player | 0.5 | 0.6 | 0.3 | 0.1 | |||||||||
| Chromium | 0.2 | 0.1 | 0.1 | 0.1 | 0.4 | 0.2 | 0.1 | 0.1 | 0.1 | ||||
| IEMobile | 0.1 | 0.1 | 0.1 | 0.2 | 0.3 | 0.2 | 0.1 | 0.1 | |||||
| Phantom | 0.2 | 0.1 | 0.1 | 0.2 | 0.7 | ||||||||
| Other | 0.2 | 0.1 | 0.9 | 0.1 | 0.9 | 0.5 | 0.7 | 0.2 | 0.1 | 0.7 | 0.6 | 0.6 | 0.6 |

